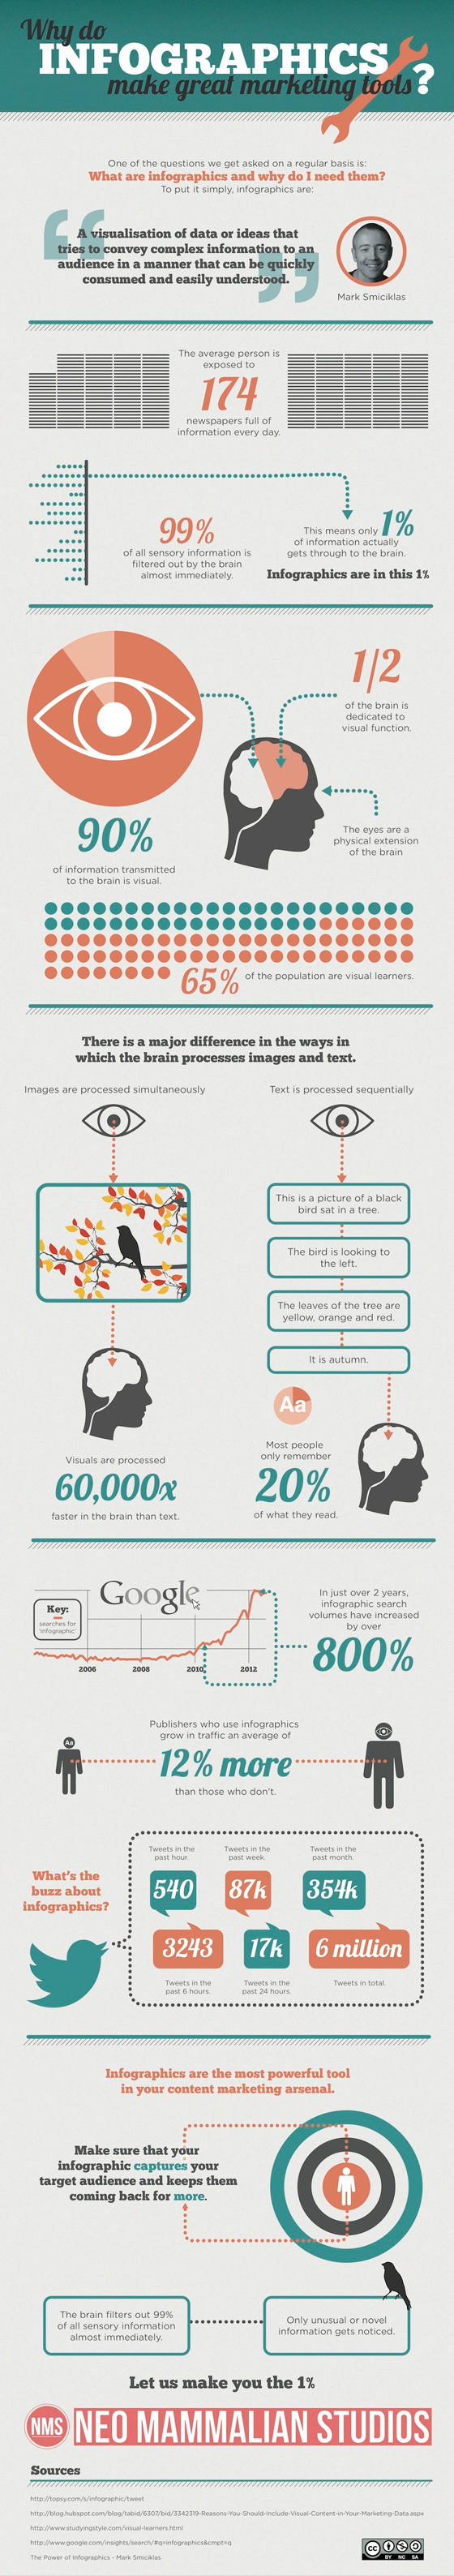
- 90% of the information transmitted to the brain is visual (source: Unbounce)
- 65% of the population are visual learners (source: Unbounce)
- In the last 2 years, search volume for “infographic” and “infographics” has increased by 800% (source: Google Trends (chart above))
Infographics are graphic visual representations of information, data or knowledge intended to present complex information quickly and clearly.
Infographics have been around for many years. In newspapers, infographics are commonly used to show the weather, as well as maps, site plans, and graphs for statistical data. Modern maps, especially route maps for transit systems, use infographic techniques to integrate a variety of information.
The increase in the number of easy-to-use digital tools has made the creation of infographics widely available to everyone. Social media sites allow for individual infographics to be shared and spread around the world.
Visual.ly and Piktochart are two companies that offer great platforms for creating infographics. We, at BarnRaisers, are big believers in the value of infographics for our clients. Here’s a recent one we did for the Interactive Advertising Bureau (IAB) on Eight Reasons Why Digital Advertising Works for Brands.
What makes infographics so effective. Infographics tell stories that are in sync with way we like to learn and retain information as human being.
Here are 20 powerful reasons to use infographics.
- People who follow directions with text and illustrations do 323% better than people following directions without illustrations
- People remember 80% of what they see (source: The Content Cloud)
- Researchers found that color visuals increase the willingness to read by 80% (source: NeoMam Studios)
- 70% of all our sensory receptors are in our eyes (source: NeoMam Studios)
- 67% of the audience is persuaded by the verbal presentation that has accompanying visuals (source: NeoMam Studios)
- 50% of the audience are persuaded by a purely verbal presentation (source: NeoMam Studios)
- 50% of the brain is active in visual processing (source: Piktochart)
- 45% more web users click on a link if it features an infographic (source: Bit Rebels)
- 40% of people respond better to visual information than text (source: AnsonAlex)
- 30% of those who click share on an infographic then share the infographic(source: Bit Rebels)
- People only remember 20% of what they read (source: Unbounce)
- Only 20% of people read past headlines in text articles (source: Buzzsumo)
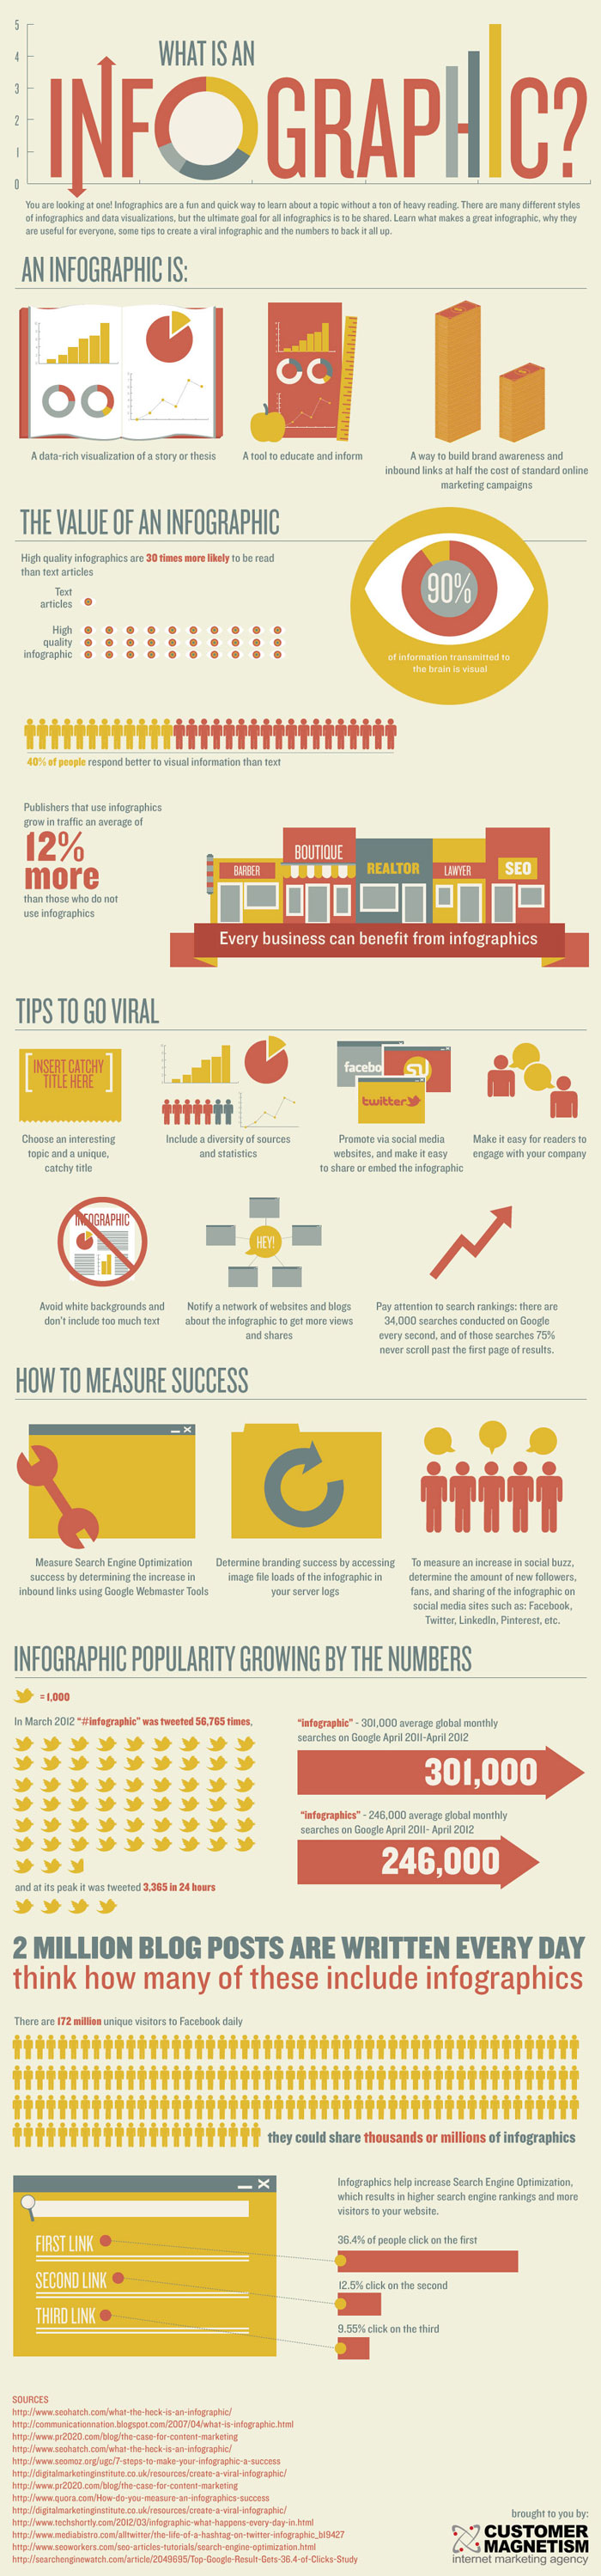
- 12% more web traffic for publishers who use infographics vs. those who don’t (source: Unbounce)
- Infographics are 30X more likely to be read than a purely textual article (source: The Content Cloud)
- The words “infographic” and “infographics” are searched an average of 547,000 times per month in Google; 301,000 search “infographic” and 246,000 search “infographics” (source: AnsonAlex)
- Visuals are processed 60,000 times faster than text (source: Unbounce)
- Infographics get 540 Tweets in an hour; 87,000 in a week; 345,000 in a month; 6,000,000 in total (source: Unbounce)
- 41,000 Re-Tweets from 2010 to 2012 for KISSmetrics referencing their infographics (source: The Content Cloud)
- The average person is exposed to 174 newspapers full of information every day (source: Unbounce)
- 1/10 of a second is how long it takes us to get a sense of a visual scene (source: NeoMam Studios)
Below are infographics from Customer Magnetism and NeoMam Studios that tell the story of infographics effectiveness in word and visuals.
Do these reason convince of the power of infographics for storytelling?


[…] Source: barnraisersllc.com […]