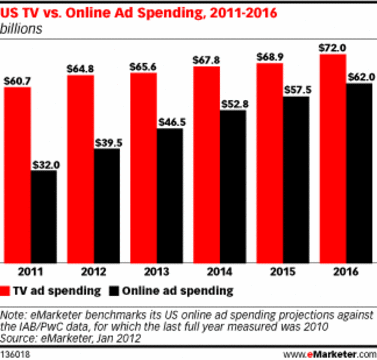
It is expected, by 2017, online ad spending will equal TV ad spending in the U.S. In 2012, online ad spending overtook all print media spending combined.
Within online ad spending, the fastest growing segment is advertising on social networks.
Is advertising changing from a monologue to a conversation?
Decide for yourself. Here are 27 surprising facts and charts about social media ad spending.
SPENDING TRENDS
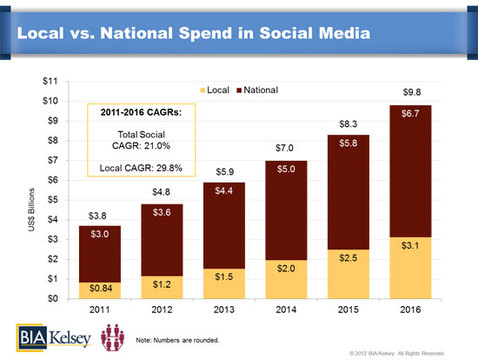
- $11.0 billion is expected to be spent on social media advertising by 2017 in the U.S. (Internet Retailer)
- $4.7 billion was spent in advertising on social networks in 2012; 12% of total online ad spending (Internet Retailer)
- $1.0 billion of Facebook’s ad revenue is expected to be in mobile for 2013 (Social Media Today)
- $1.2 billion (or 25%) of social media ad spending was local by 2012; $3.1 billion (or 31%) is expected to be local by 2016 (BIAKelsey)
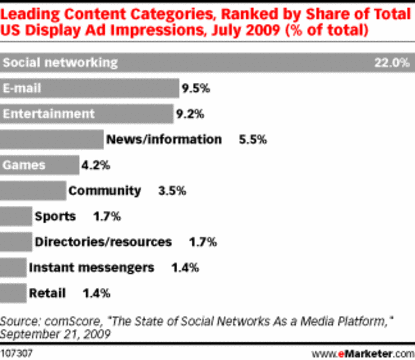
- At a 22% growth rate in terms of impressions, advertising on social networks is the fastest growing of all online display advertising (Source: eMarketer)
- Double-digit growth is expected for online and social media ad spending through the rest of the decade while all other media channels will be single digits or in declinee (Source: IAB)
AD SPENDING BY SOCIAL NETWORKS
- 57% of social media ad spending occurs on Facebook (Go)
- 13% on YouTube
- 13% on Twitter
- 2% on Pinterest
- 15% on All Other
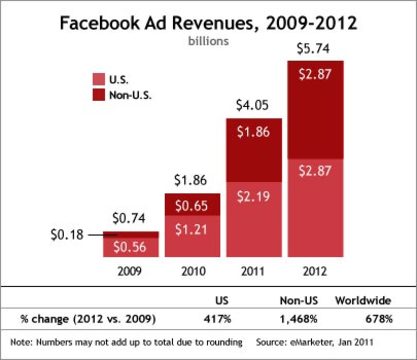
- 50% of Facebook ad revenue was non-US in 2012; up from 35% in 2010 (eMarketer)
- 500 unique customer groups exist on Facebook. For example, you can target “cereal buyers,” “hot cereal buyers” or “fiber cereal buyers.” (Internet Retailer)
- 27 different ad options are offered by Facebook to tie ads to business objectives that marketers care about like in-store sales, online conversions and app installs (Social Media Examiner)
- 92% of marketers indicated, with as little as 6 hours a week, they saw an increased exposure for their business from their social media efforts (Top Web Design Schools)
- 62% of companies that spend 40+ hours on social media saw increases in business (Top Web Design Schools)
- 55% increase in recall is seen in Social vs. Non-Social online ads (Social Media Today)
- 53% increase in recall of Twitter ads is seen from Twitter mobile users vs. regular Twitter users (Social Media Today)
- 45% of companies using social media advertising use it for branding; 16% for direct response 25% for both (Go)
- 40% of Twitter users regularly search for products via Twitter (Social Skinny)
- 4X increase in engagement is seen from Mobile Rich Media ads vs. regular mobile ads (Mobile Marketer)
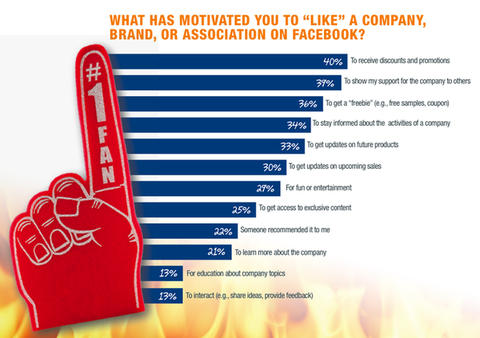
- #1 People are motivated to “Like” a brand on Facebook is to receive a discount or promotion (BarnRaisers)
- 71% of agencies ran social media ad in conjunction with other online advertising (Social Media Today)
- 41% ran with other offline advertising (Social Media Today)
- 34% of marketers have generated leads using Twitter (Social Media Today)
MEASUREMENT
- 62% of companies with 10 of fewer employees said social media reduced their marketing expenses.(Top Web Design Schools)
- 25% were able to measure return on investment (ROI) (Top Web Design Schools)
The idea for this post came from Cara Delany who was nice enough to send along the infographic below.
Do these facts surprise you? Do the change your mind about social media advertising? Do they help explain why social media ad spending is growing?




[…] out these facts compiled by https://barnraisersllc.com/2013/06/surprising-facts-and-charts-social-media-advertising/ on social media’s […]