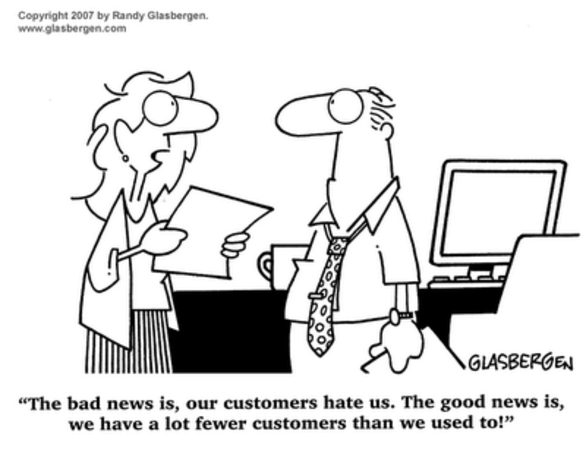
- 89% of consumers have stopped doing business with a company after experiencing poor customer service. (RightNow Customer Experience Impact Report)
- 70% of buying experiences are based on how the customer feels they are being treated. (McKinsey)
- 6-7X more costly to attract a new customer than it is to retain an existing customer. (SalesForce)
Is customer service a top priority at your company? These statistics indicate it should be.
Being consumer-centric is a business strategy; one that places top priorities on having a relationship, earning trust, rewarding good customers and forgetting about marketing.
It’s also an investment. How do you prove it’s worth it? And measure it?
Key Performance Indicators (KPIs) are business metrics tied to a target. They are used to evaluate factors that are critical to success. KPIs are the actionable scorecard that keep business strategy on track.
What are KPIs to track outstanding customer service? Here are 20 consumer-centric KPIs to consider.
HAVING A RELATIONSHIP
- CUSTOMER RETENTION RATE: The number of customers who renew their services or make additional purchases from the company during a defined period of time divided by number of active customers.
- CUSTOMER CHURN: The number of customers who opt to not renew at the end of their subscription in a given time period divided by the number of customers whose subscriptions end.
- CUSTOMER SATISFACTION SCORE (CSAT): Outstanding customer service organizations keep a constant pulse of their customer satisfaction (CSAT) score. By giving a simple survey after a customer has completed their experience with customer service, managers gain insights to build and develop their business.
- NET PROMOTER SCORE (NPS): The number of customers who would recommend your brand to their associates (e.g., friends, family, acquaintances) divided by the total number of customers is known net promoter score (NPS).
- CONVERSION RATE: After someone from your customer service team interacts with a customer, how likely are they to make a purchase or take some other kind of action? If your customer service is good, this number should be fairly high.
EARNING TRUST
- AVERAGE RESOLUTION TIME: If you’re able to keep that resolution time relatively low, that could be an indication of good customer service and another way to measure customer service.
- FIRST CONTACT RESOLUTION RATE: The number of inbound calls that are resolved on the first contact without the need for transfer or subsequent contacts divided by the total number of inbound calls.
- AVERAGE WAIT TIME: Even if you do respond quickly to an issue, how long does it take for you to get back to that customer? Measured both by if a customer calls or writes an email.
- CALL ABANDONMENT RATE: The percentage of inbound phone calls made to a call center or service desk that are abandoned by the customer before speaking to an agent.
- NUMBER OF COMPLAINTS PER DAY: Number of complaints received from clients by the customer representative staff.
- ESCALATION RATE: Number of technical or product complaint calls that are escalated from customer service representatives to supervisors/managers for resolution divided by the total number of complaint calls, as a percentage.
- COST PER COMPLAINT: The total expense (labor, materials, shipping, etc.) for the incident management group divided by the total number of incidents processed.
- DAILY RETURN RATE: The average daily number of returned products received and processed.
REWARDING CUSTOMERS
- ENROLLMENT CONVERSION RATE: The number of customers who choose to enroll in the customer incentive program during a defined period of time (e.g., quarterly, yearly) divided by the total number of customers.
- REWARDS ATTAINABILITY: The number of reward program participants who redeem accrued reward points/credits during a defined period of time divided by the number of participants who have reward points/credits to redeem.
- REWARDS ACCRUAL RATE: The value of rewards accrued by the average customer divided by the total purchase amount of the average customer during the same period of time.
- REWARDS BREAK RATE: The number of accrued rewards that are not be redeemed by members of the customer incentive program divided by the number of accrued rewards available.
PROVING REVENUE
- ANNUAL CUSTOMER VALUE (ACV): The average dollar value of a customer over one year.
- LIFETIME CUSTOMER VALUE (LCV): The net profit gained from a single customer over the ‘lifetime’ relationship with the good/service/company. This is generally generated by predictive analysis and forecasting because it is used to make longer term revenue projections.
- CASH FLOW: If your service is bad, it could drive customers away, decrease referrals and cause potential customers not to complete purchases. But if it’s good, customers are likely to come back, tell their friends and have a big impact on your company’s overall profits.
Do these KPIs help you measure customer service? How do you think your business does on these metrics? Do you need help with the metrics to keep the business strategy on track?


