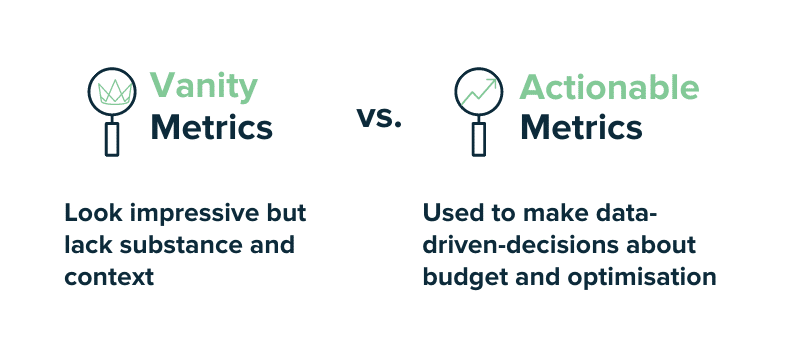
Vanity vs actionable metrics
Knowing the difference between vanity vs actionable metrics clears up a lot of confusion about the metrics that matter for your business.
Vanity metrics are statistics that look spectacular on the surface but don’t necessarily translate to meaningful business results. Moreover, they rarely inform key strategic decisions. On the other hand, actionable metrics translate to business performance. Actionable metrics relate to specific actions that can be tied to real business results.
What are examples? Here are 21 vanity vs actionable metrics every marketer needs to know. And a brief definition of each.
Vanity metrics
- Social Followers: People who click to follow your social media page.
- Likes: People who like your social posts.
- Social Page Views: People who have viewed your social media page, generally over the past month.
- Impressions: The number of people who see your ad when it is shown or appears on a search page. Note: Bot traffic, which some estimates say is as high as 50% are usually included in these numbers.
- CPM (Cost per Thousand): The amount of money an advertiser pays for every thousand people who see their ad.
- Reach: The number of people an ad or post reaches.
- Frequency: How many time these people receive your ad or post.
- Clicks: People who click on an ad.
- Avg Time on Page: The average time someone spends on a web page. What business should pursue the average person?
- Avg Pages per Session: The average number of pages someone views when visiting a website. Same criteria as above.
Actionable metrics
- Conversions: Actions that produce a desired outcome. Businesses generally have more than one leading to sales for a B2C business or a high value lead for a B2B business as the most important conversion.
- Conversion Rate: For digital marketers, the percent of people who produce a desired outcome on a website divided by the visits to the website.
- Cost/Conversion: The cost for conversion actions.
- Cost Per Acquisition (CPA): The cost to acquire a new customer.
- Customer Reviews and Customer Satisfaction: Ratings and reviews and surveys that gauge customer satisfaction.
- Retention Rate: The percent of customers that purchase regularly.
- Churn: The percent of customers that regularly leave or switch for a competitive product or offering.
- Average Order Value: The average dollar amount when someone makes a purchase.
- Cart Abandonment: On an ecommerce website, the percent of people who put items in a cart but don’t go through with the purchase.
- Customer Lifetime Value (CLV): The total revenue a business earns from a customer over their lifetime as a customer. This can also be measured annually for Annual Customer Value.
- New Promoters Score: How customers rate a company, product or service (on a scale of 1 to 100) to a single survey questions, ‘How likely is it that you would recommend this company to a friend or colleague.”
Top actionable metrics often turn out to be Key Performance Indicators (KPIs). When measured in line with a critical business goal, they can be predictable and actionable ways of ensuring that a business gets to the goal of where it needs to go.
In digital marketing, for a B2C business, the goal is often sales or revenue. For a B2B business, it is usually a qualified lead that a sales person can close. In either case, actionable metrics are the way to go.
Do these example of vanity vs actionable metrics help you in knowing what your business should be measuring?


